Download Addinsoft Zenplot 1.1.0 for Windows
Free download Addinsoft Zenplot 1.1.0 full version standalone offline installer for Windows PC,
Addinsoft Zenplot Overview
This software is built for people who want more freedom when creating charts. Instead of being limited to fixed templates, it lets you stack multiple graphic layers on top of each other, just like building with transparent sheets. Each layer adds meaning, style, or context to the final visual, making complex data easier to understand and more engaging to look at. What makes it different Most chart tools feel like vending machines: pick a button and accept the result. This one feels more like a design studio. You decide how data connects to colors, shapes, sizes, and positions. That freedom means visuals can match your story rather than forcing it to fit a chart.Features of Addinsoft Zenplot
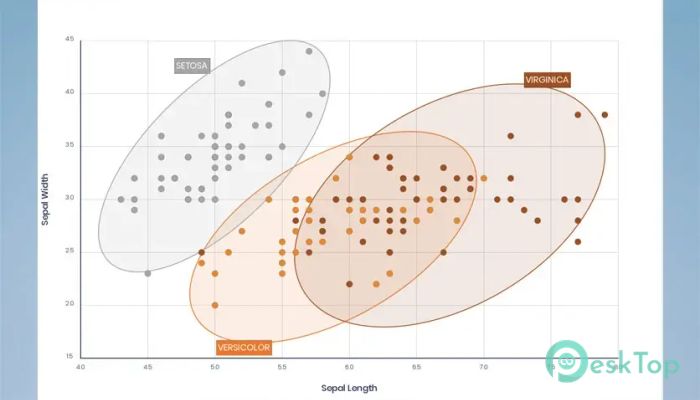
Working with multiple datasets
It supports importing one or several datasets at the same time. This is helpful when comparing trends, overlaps, or contrasts. Think of it as bringing diverse data voices into a single conversation, where each retains its identity while contributing to a broader picture.
Graphic layers explained simply
The tool offers eight main graphic layers that can be combined in countless ways. These include scatter plots, line charts, bar charts, heatmaps or 2D surfaces, area charts, histograms, labels, and annotations. Each layer can stand alone or work together, like instruments in an orchestra creating harmony.
Power of stacking layers
Stacking layers is where creativity really shines. A scatter plot can show raw points, a line chart can highlight trends, and annotations can explain key moments. When combined, these layers transform plain data into a visual story that guides the viewer’s eye naturally.
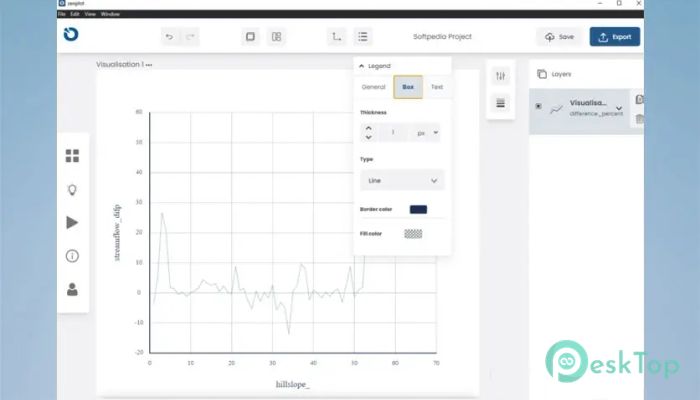
Customizing axes and legends
Axes and legends are not afterthoughts here. They can be fully customized to match the chart's design and purpose. This flexibility helps keep visuals clean and readable, especially when dealing with dense or technical datasets.
Linking data to visual elements
Data is not just plotted; it is mapped to visual characteristics. Colors, shapes, sizes, and styles can all reflect different values. It is like giving data a personality, where each trait helps the audience understand what matters most.
Annotations that add clarity
Charts can be annotated using text, images, or shapes through a friendly interface. This makes it easy to explain peaks, drops, or unusual patterns without clutter. A simple arrow or note can turn confusion into instant clarity.
Export options for professional use
Once a chart is ready, it can be exported as a PNG or SVG. This makes it suitable for reports, presentations, academic papers, or web use. SVG support is especially useful for high-quality prints and scalable graphics.
Built-in themes for quick styling
Different themes are included to speed up design work. Instead of manually adjusting every color and font, a theme can instantly give visuals a consistent, polished look. It is like changing outfits with one click.
Who can benefit from it
This tool suits analysts, researchers, students, and professionals who want precise control over how data is presented. It is also useful for anyone tired of generic charts and looking to add personality and clarity to their visuals.
Ease of use and learning curve
Despite its power, the interface remains approachable. Beginners can start with simple layers, while advanced users can dive deeper into customization. It grows with you, much like learning to cook by starting with basic recipes and later creating your own.
Why layered visuals matter
Layered visuals help viewers understand complex information step by step. Instead of dumping everything at once, layers guide attention and build understanding gradually. This approach makes data feel less overwhelming and more human.
System Requirements and Technical Details
Operating System: Windows 11 / 10 / 8.1 / 7
Processor: Minimum 1 GHz Processor (2.4 GHz recommended)
RAM: 2GB (4GB or more recommended)
Free Hard Disk Space: 200MB or more is recommended

-
Program size71.22 MB
-
Version1.1.0
-
Program languagemultilanguage
-
Last updatedBefore 6 Month
-
Downloads10